The Structure of the Physical Universe
Microcosm <<<<—————->> Combinations
Material Sector Interactions
S|T Combinations as Preons
Preons (short for pre-fermions/bosons) are postulated substructure of “point-like” particles of the standard model (SM) of particle physics. The S|T combinations, introduced in the previous section of the SPUD, form a set of scalar motion preons that have the properties of the quarks and leptons of the SM.
When instances of SUDR and TUDR entities combine, which the nature of the progression makes possible, the combination forms a one-dimensional entity corresponding to the magnitude interval between -1 and +1, a two unit interval numerically expressed, in the RSM, as
1|2, 1|1, 2|1,
which corresponds to the three integers on the number line,
-1, 0, +1,
a one-dimensional sequence of zero-dimensional numbers, where the ‘|’ symbol indicates the operational interpretation of the rational number, rather than the quantitative interpretation, indicated by the usual division symbol ‘/’. However, when the two physical units of this displaced unit motion combine (the SUDR & TUDR), the combination (SUDR|TUDR) contains four total units of space and time progression, since both scalar “directions” of the reversing aspects in each oscillating entity must be accounted for. Thus, the actual equation of the SUDR|TUDR combination is
S|T =1|2 + 1|1 + 2|1 = 4|4,
where the space (time) displacement is one unit in one of the two opposite outward “directions,” contained in the two outside terms, and also where the space (time) displacement is zero units in the single inward scalar “direction” contained in the middle term of the equation. Graphically, this initial combo, the S|T combo, can be illustrated as in figure 1 below.

Figure 1. The SUDR|TUDR (S|T) Combo as a Space|Time Preon
While the graphic illustration of the S|T combo necessarily draws it in space, the physical magnitudes that constitute it are created by two scalar expansions/contractions of space and time, which have no spatial separation between them, but only numerical separation corresponding to an ordered sequence of space|time magnitude. Thus, the graphic of space|time in figure 1 is a representation of an oscillating point, which alternately expands to a unit sphere and contracts to a point, at the speed of light in both space and time, from the perspective of the unit datum. The colors indicate the scalar “direction” of the space|time displacements with respect to the spatial location: Hence, the green dot in the middle is “higher” than the red dot, just as the frequency of the color green is “higher” than the frequency of the color red, but “lower” than the frequency of the color blue of the right-hand side. The magenta color used in the previous section of the SPUD has been reserved for a special combination explained below.
If the magnitude of the space displacement is equal to the magnitude of the time displacement, the color green also represents this balance, but, if one is greater than the other, we can represent the resulting imbalance qualitatively by changing the color of the middle dot accordingly. This also can be expressed quantitatively with the S|T equation. For example, the equation of an S|T with two SUDRs and one TUDR would be
S|T = 2|4 + 2|1 + 2|1 = 6|6,
and its corresponding graphic is

indicating that the unbalance is in the red “direction” of more space displacement than time displacement.
Of course, the equation of the inverse of this imbalance is
S|T = 1|2 + 1|2 + 4|2 = 6|6,
and its corresponding graphic is

indicating that the unbalance is in the blue scalar “direction” of more time displacement than space displacement. It is important to note that, as can be seen from the respective equations, a given imbalance in space|time displacement of the two outward terms is always reflected in a corresponding inward space (red), or inward time (blue), displacement in the middle term of the equation.
Now that we have graphic representations of space|time combinations the next question is, can we combine them, in a way that corresponds to a toy model, to form the known entities of the standard model (SM) of particle physics in our RST theory? Of course, our graphics of space|time are not physical lengths, in the sense of one-dimensional spatial objects, but representations of quantities of 3D scalar motion combinations, much like quantities of paint.
However, they do represent definite points in coordinate space and time, and, just as the most stable configuration for three adjacent points in coordinate space is a two-dimensional triangle, so too the representation of three S|T combos would be a two-dimensional triangle, where the space displacements of each S|T are combined with the time displacements of an adjacent S|T, forming a very stable combination. The graphic illustration of this combination, where all three entities are instances of the green (balanced) S|T, is shown below in figure 2.

Figure 2. Combination of Three Green S|T Combos.
Again, while it’s necessary to draw these space|time relationships in space, to illustrate them, the graphic is only representing numerical magnitudes. The actual physical configuration would be that of three adjacent points, periodically expanding to unit spheres, and contracting to points. Questions regarding why, how, and if the inherent space|time expansions and contractions of these oscillations (six of them all together) might be in or out of phase to some degree, will be deferred for now. The important thing at the moment is the recognition that the positive/negative attraction at the vertices is the most stable combination involving the minimum number of elements forming a stable combination.
However, the most relevant observation for our purpose is that all the possible space|time perturbations of this combination of three S|T units form a group under addition. The members of this group, following the same group of triplets in Bilson-Thompson’s toy model, correspond to the fermions of the SM. Figure 3 below depicts the members of the group graphically:
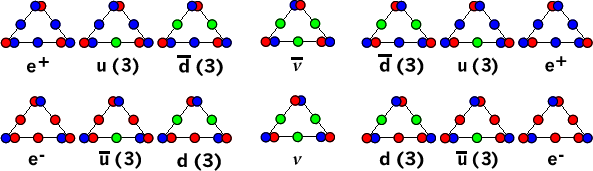
Figure 3. The Triplet Group of S|T Combinations
The number three in the parentheses of the quarks indicates the three so-called color charges, representing the three possible configurations of the constituent S|T units of the combo; that is, if we label the S|T units so that the left member is A, the right is B, and the bottom is C, then the three possible perturbations of the down quark, for example, with two green and one red S|T, are

Just as in Bilson-Thompson’s model, we have two symmetries here. The chiral symmetry of left and right handedness, and the polar symmetry of positive and negative poles, for all entities other than the neutrino and antineutrino, which are the “identity” entity of the group. Again, however, unlike in the case of the Bilson-Thompson’s model, we can’t properly employ the concept of spatial orientation to depict these symmetries through rotation, because the symmetry of space|time magnitudes is not the same. Hence, the left, right, handedness is depicted by the red-blue Z-order of the vertices, indicating a change of perspective from the two sides of unity.
On this basis, red on the left of blue indicates the material sector, with s/t dimensions of velocity, in less than the unity of c-speed, the sector where we reside, and the blue on the left of red indicates the inverse, or cosmic, sector, with t/s dimensions of inverse velocity, or energy, from the material sector perspective, although the usual convention of signs is reversed here, to permit easier comparison with Bilson-Thompson’s model. However, it should be stressed that this is a preliminary version of the parallels and is subject to later revision.
The combinations that constitute the bosons of the SM can also be depicted as combinations of S|T units. These would be combinations where each SUDR and TUDR of the combined S|T units are connected to every other in the combo, as shown in figure 4 below: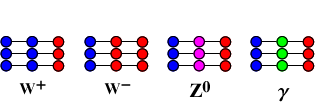
Figure 4. S|T Combos Corresponding to the Bosons of the Standard Model
As explained previously above, the color of the center dots represents the space|time “direction” of the inward scalar motion of a given S|T unit. Thus, blue in the center indicates net scalar motion magnitude in the inward time “direction,” while red in the center indicates net magnitude in the inward space “direction.” In the case of the Z0 boson, the magenta color in the center represents a combination of the red and blue units, which is a combination of both inward time and inward space scalar motion.
There is much more work to be done on these combinations, and changes will surely be necessary in the future.
——————————————————————————————————————————
The RSt Concept
Discuss the RSt Concept
——————————————————————————————————————————
The LRC Concept
Discuss the LRC Concept
——————————————————————————————————————————
The LST Concept